Viewing Forecast
In this section, you will learn how create a forecast run anf view a forecast run result. In addition, you will also get to know how to view forecast history runs.
Creating a Forecast run
Pre-requisities:
- Your
.csvis uploaded and mapped in the workspace.
To create a forecast run, do the following:
-
Open your Workspace that contains the mapped
.csv. -
Select the Insights tab, and then select the Forecast tab.
-
In Features 1, select the mapped feature you want to forecast.
-
Set Start Date and End Date for the historical window.
-
In Forecast Model, select one of the following options
-
Holtwinters: Exponential smoothing that handles level, trend, and seasonality. Select this option when you see repeating seasonal patterns and want a fast, stable baseline.
-
Sarimax: ARIMA with seasonality + exogenous regressors. Select this option for seasonal series where external drivers (e.g., holidays, events) may improve accuracy.
-
SEQ25SEQ: Sequence-to-sequence (neural) forecaster for complex, non-linear patterns. Select this option when classical models underfit and you have enough data.
-
Sktime_Naive: Simple baseline (e.g., last value or seasonal naive). Use this option when you want to do a sanity check to ensure fancier models actually add value.
-
Arima: Classic auto-regressive + differencing + moving-average. Use this option for non-seasonal or weakly seasonal series with autocorrelation but little complex structure.
-
-
In Forecast Steps, type a number (e.g., 10).
-
In Imputation, select oen of the following options:
- Zero: Fill gaps with 0. Select this option only when a missing point truly means no activity (risk of bias otherwise).
- Average: Fill gaps with the series mean. Select this option when missingness is rare and you need a neutral filler without strong trends.
- Previous Value: Carry forward the last observed value. Select this option for operational/time-continuous data where short gaps likely hold steady.
-
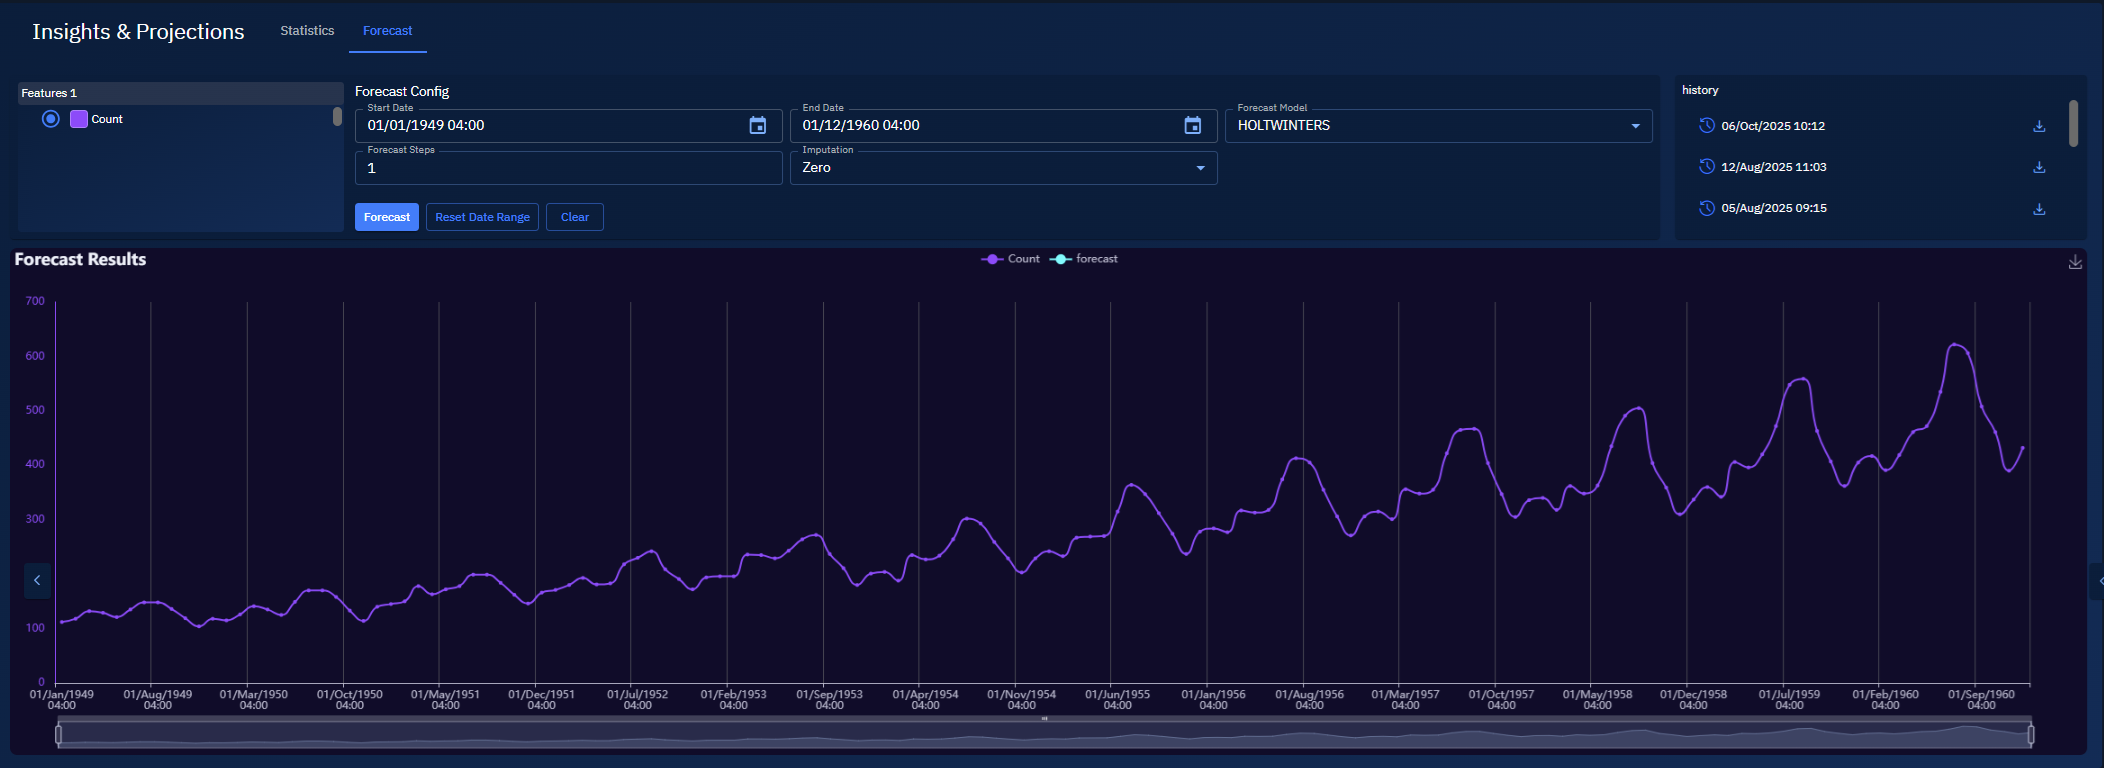
Click the Forecast button.
The system generates a run and displays the historical + forecast plot.
Viewing a historical forecast runs
You can review previous forecasts without re-running them.
To view a historical forecast run, do the following:
- In the History area, turn-off the Forecast option on the chart.
- Locate the historical run that you want to view and then select it.
The system displays the historical plot for that specific historical run.
Viewing forecast output
You can view histrical + forecast results.
To view a historical forecast run, do the following:
- In the History area, ensure both the Count and Forecast options are turned on on the chart.
- Locate the historical run that you want to view and then select it.
The system displays forecast chart with the historical + forecast view for that specific historical run.