Bands Rendering
Bands rendering enables you to transform complex raster data into meaningful visual information. In addition, you can also create your own rendering profile that you run of any of the raster layers to visualize data as per your preference.
For example, when you are monitoring vegetation health, you can combine near infrared and red bands to create visualizations that clearly show plant growth. However, for urban development studies, you can use bands rendering to highlight built structures versus natural surfaces.
How does Bands Rendering work?
This functionality is an automated visualization system. The platform enables you to render bands in two ways:
When you select a raster dataset, the platform intelligently examines the data structure and enables you to do bands rendering in two ways:
-
Automatic: Allows you to just select one of the predefined profiles.
-
Manual: Allows you to create your own render profile to have granular control over how your raster data is displayed on the screen.
Rendering a band
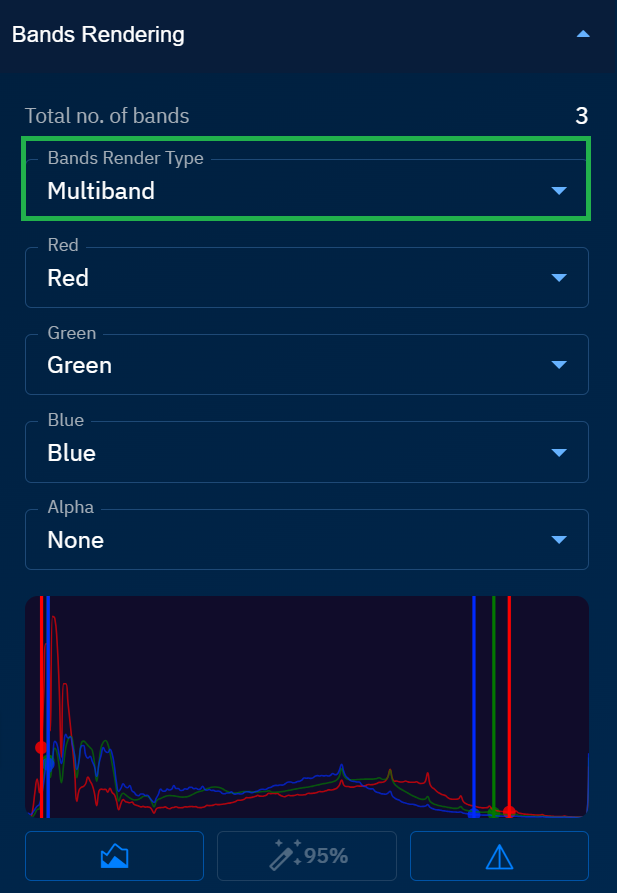
In the approach, when you select a raster dataset the platform displays the total number of bands available enabling you get insights into the complexity and potential visualization options for your data. You can manually adjust every aspect of the visualization for more specific analytical needs.
The platform then proceeds to selects the most appropriate rendering method from three possible options: Multiband, Singleband Grey, and Singleband Pseudocolour.
To execute bands rendering, do the following:
-
Search raster datasets in the platform.
-
Select a layer from the search results.
-
Click the More Options menu, click the Eye icon to turn on the layer visibility, and then click the Zoom into Layer option.
-
In the Contextual Details Panel, click the Bands Rendering area.
Depending on the raster dataset that you select, the platform will automatically display the total number of bands available for rendering and one of the three band render types:
-
Multiband: Select to assign different bands to the red, green, and blue channels, with precise control over the min-max values for each channel.
-
Singleband Grey: Select a single band to display in grayscale.
-
Singleband Pseudocolour: Select a single band and apply a color scheme to represent different values.
- After selecting the bands render type, you can further refine the visualization using the raster adjustment controls as per your visual preference:
-
Adjust the RGB and fine tune alpha (transparency)
-
Load the histogram data in the viewport to optimize the display for the specific region
-
Adjust 95% cut of the data distribution to enhance image display
-
Adjust sharpness to improve the visibility of boundaries and detailed features
- Click Apply button.
Render Profile
You can create your own render profile and load it on any raster layer. This feature enables you to transform complex raster data and visualize the information as per your preference.
Creating a Render Profile
Create a preset filter to visualize raster data as per your preference.
To create a render profile, do the following:
-
Search raster datasets in the platform.
-
Select a layer from the search results.
-
Click the More Options menu, click the Eye icon to turn on the layer visibility, and then click the Zoom into Layer option.
-
In the Contextual Details Panel, click the Bands Rendering area.
Depending on the raster dataset that you select, the platform will automatically display the total number of bands available for rendering and one of the three band render types:
-
Multiband: Select to assign different bands to the red, green, and blue channels, with precise control over the min-max values for each channel.
-
Singleband Grey: Select a single band to display in grayscale.
-
Singleband Pseudocolour: Select a single band and apply a color scheme to represent different values.
- After selecting the bands render type, you can further refine the visualization using the raster adjustment controls as per your visual preference:
-
Adjust the RGB and fine tune alpha (transparency)
-
Load the histogram data in the viewport to optimize the display for the specific region
-
Adjust 95% cut of the data distribution to enhance image display
-
Adjust sharpness to improve the visibility of boundaries and detailed features
-
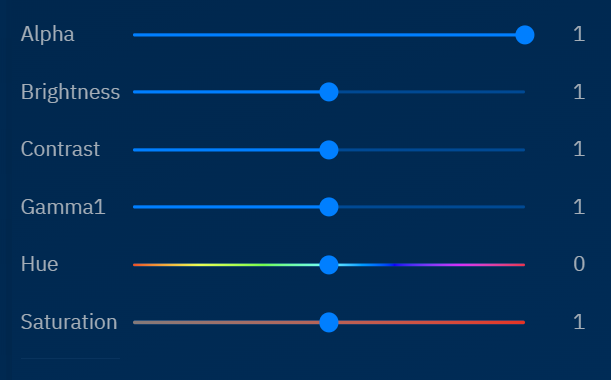
Adjust Alpha, Brightness, Contrast, Gamma1, Hue, and Saturation. For more information, see Adjusting Raster
-
Click Apply button.
-
Click the Render Profile area and then click the + Save button.
The Save Rendering Profile dialog box is displayed.
-
In the Save Rendering Profile dialog box, type the name of the render profile, and click Save.
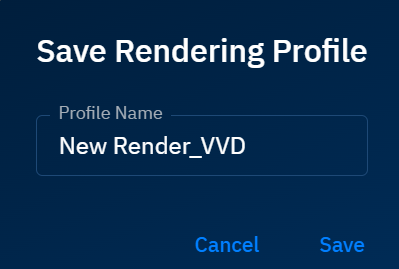
A new render profile is successfully created using all the raster adjustment controls you made in Step 5.
Loading a Render Profile
To load a render profile, do the following:
-
Search raster datasets in the platform.
-
Select a layer from the search results.
-
Click the More Options menu, click the Eye icon to turn on the layer visibility, and then click the Zoom into Layer option.
-
In the Contextual Details Panel, click the Render Profile, and then click the Load button.
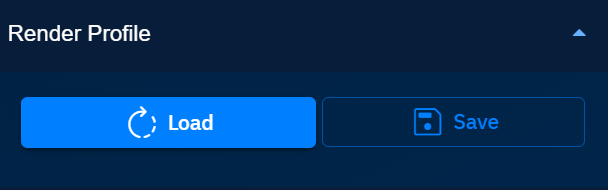
The Load Profile dialog box is displayed.
-
In the Load Profile dialog box, do the following:
- Type the name of the render profile in the Search field to find the profile you want to load.
- Select the render profile.
- Click the Apply button.
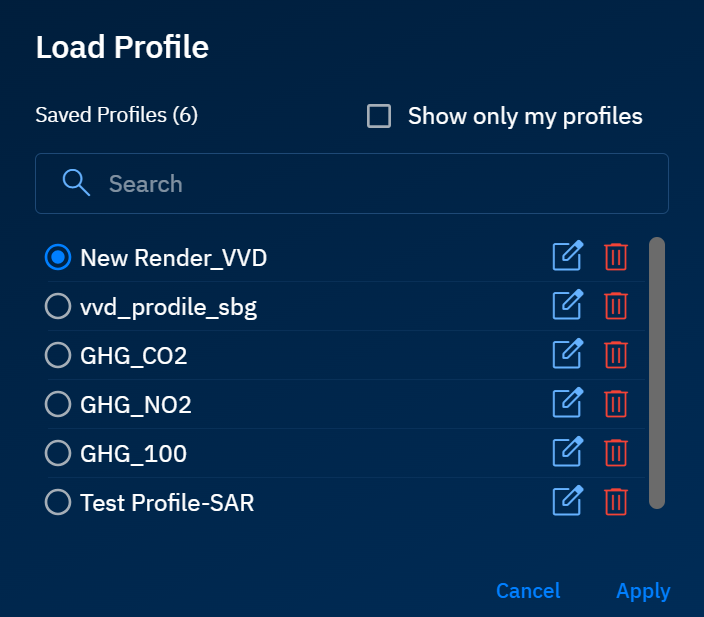
The platform successfully runs your render profile on the layer and displays the visual results.
Adjusting Raster
You can visualize a layer by adjusting transparency for multi-layer analysis, fine-tuning display parameters for optimal viewing, and resetting option if needed. Furthermore, you can use raster adjustment to enhance contrast to better distinguish features, adjust brightness for dark or bright areas, and use gamma correction for better detail in shadows or highlights.
| Band Adjustment Slider Name | Description | Usage |
|---|---|---|
| Alpha | Controls the transparency level of the raster. Value of 1 indicates full opacity. | Useful when working with multiple layers. |
| Brightness | Adjusts overall luminosity of the image. Default value of 1 represents standard brightness. | Helps in areas with poor visibility. |
| Contrast | Controls difference between light and dark areas. Default value of 1 represents standard contras | Helps in distinguishing features. |
| Gamma | Adjusts mid-tone values. Default value of 1 represents standard gamma correctio | Helps in balancing image exposure. |
| Hue | Adjusts color tint of the image. Default value of 0 indicates no color shift. | Represented by a color gradient slider. |
| Saturation | Controls color intensity. Near maximum setting for enhanced color display. | Helps in enhancing or reducing color vividness |