Platform Flow
This document explains the operational workflow of an gIQ - the AI-powered geospatial analytics platform designed to streamline data ingestion, model execution, and insight generation. The platform follows a structured workflow of data that guides users from initial data sourcing through to generating and viewing stories and reports
Platform Workflow
Platform Architecture
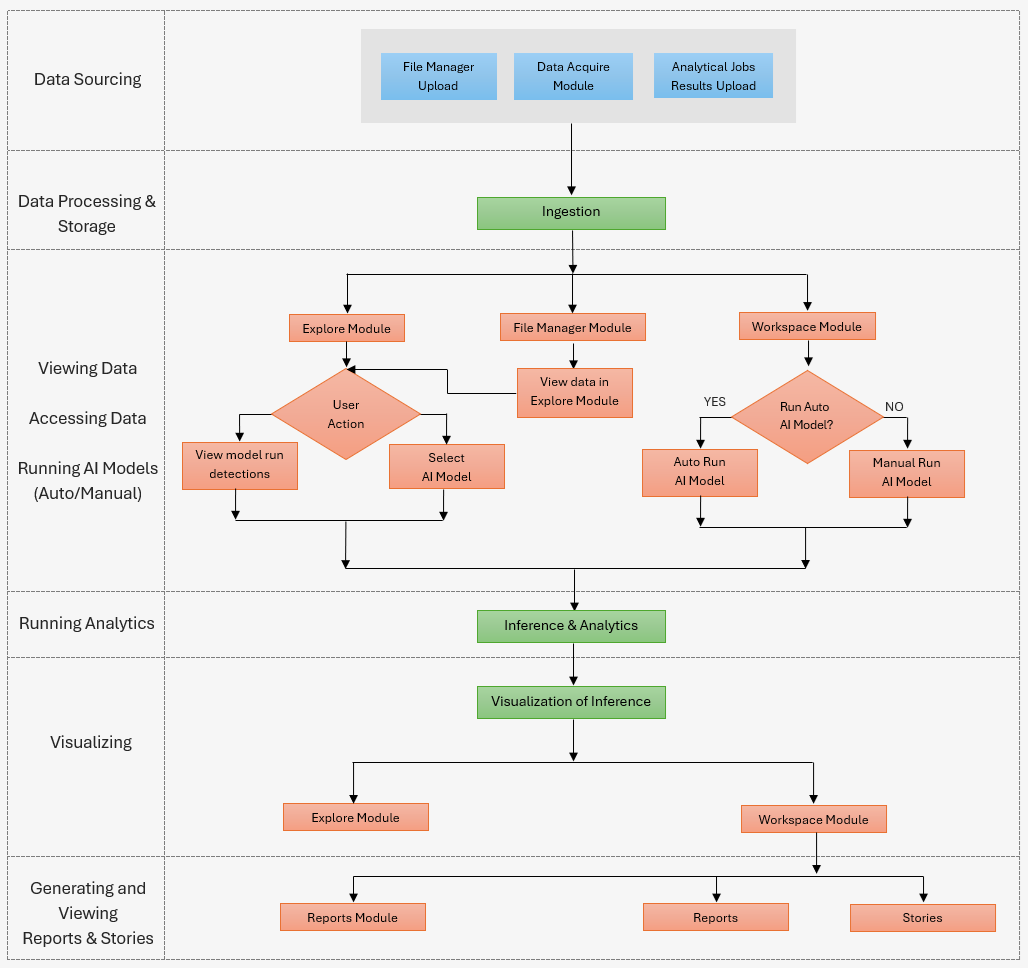
The platform operates through seven distinct operational layers, each serving a specific function in the analytics pipeline:
1. Data Sourcing Layer
As a user, you can introduce data into the platform through the following parallel entry points:
-
File Manager Upload: Direct file upload functionality for structured datasets.
-
Data Acquire Module: Data acquisition from verified external vendors and partners.
-
Analytical Jobs Results Upload: Results of analytical jobs ingested in the platform.
These entry points operate independently, enabling you bring in data from different sources into the platform.
2. Data Processing & Storage Layer
All incoming data flows through a centralized Ingestion process. This data consolidation point ensures that regardless of the entry method, your data goes through a three-tiered layer of processing, validation, and storage protocols before it becomes available for analysis.
3. Viewing Data & Accessing Data Layer
Following ingestion, the platorm branches your data into three distinct pathways:
Explore Module: View your data in an interactive exploration space where you can examine datasets, perform ad-hoc several tasks and actions, and understand your data better through properties, metadata, detections, and image bands (if applicable).
File Manager Module: Organize, catalog, and maintain your data assets within the platform.
Workspace Module: Analyse data and create reports and stories enabling you with a critical decision point.
4. Running AI Models Layer
The Workspace Module introduces a decision node: "Run Auto AI Model?"
YES pathway: The platform automatically selects and executes appropriate AI models based on data characteristics and analytical objectives. This pathway reduces the technical burden on users by leveraging built-in intelligence.
NO pathway: Enables you to run Manual Run AI Model providing granular control over model selection and parameter configuration.
Simultaneously, the Explore Module supports two user actions:
-
View model run detections: Enables you to examine results from previously executed models
-
Select AI Model: Allows direct model selection from the exploration interface
These pathways converge before proceeding to the analytics phase, ensuring all model executions follow a unified output protocol.
5. Running Analytics Layer
Model outputs feed into the Inference & Analytics process, where the platform uses built-in intelligence and and prepares analytical insights from model predictions.
6. Visualizing Layer
Analytical results flow into Visualization of Inference, which transforms quantitative outputs into visual representations, enabling you to view the visualization in the following modules:
-
Explore Module
-
Workspace Module
7. Generating and Viewing Reports & Stories Layer
The final layer provides three distinct output formats:
Reports Module: View reports that you and/or your team mates in the organization generated.
Reports: Create standardized analytical reports with consistent formatting and metrics.
Stories: Creates narrative-driven presentations that contextualize findings within business scenarios.