Introduction
Updated: February 3, 2024
Updated By: Shaun Campbell
This section of the documentation is the user manual for some common roles. These have been identified as the Analyst, the Administrator and the Data Scientist. The gIQ product gives a huge amount of flexibility to define a series of different roles and name them in accordance with your organisational goals, so use these guides as a handrail to establishing a structure, but you are welcome to define your own roles according to the needs of your organisation.
This page will explore some of the more common basic functions, such as product layout and high level scope for the product and the features contained within. For specific workflows and guides, please consult the "user guides" section of this documentation website.
The exploration page
This is a feature available for all users in the product.
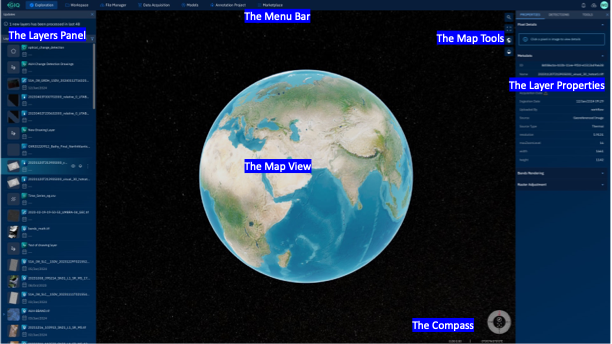
The exploration view is the part of the product which allows a user to visualise all of the spatial data within the organisation. It consists of several areas, which the other guides may refer to.
Changing the base maps
gIQ currently offers three different base maps. They are the raster base map, the vector base map and turning the base map off (also known as the black base map). This guide will show you how to cycle through the different options.
The default view
The default view is the raster base map.

Click on the basemap option
This will cycle through to the vector base map next

Click on base map
The next option will cycle through to the black base map

Symbology
On the left hand side you will find the list of the layers. This is the spatial data within the product. For each layer you will see the layer name, the acquisition date if it is available, a thumbnail of the layer, and an icon for the layer type. A list of the icon meanings is below.
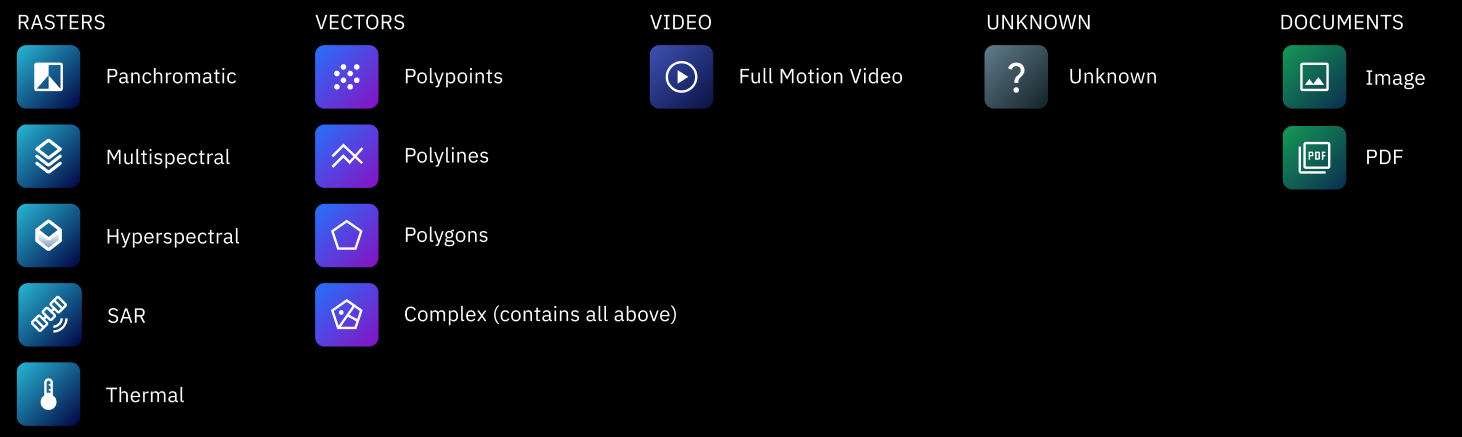
This symbology also exists in other areas of the product, including the workspace and the file manager.
On the same card, there are several options. These allow a user to visualise the layer, visualise the footprint and to open up more options. These more options allows a variety of capabilities, includings adding the file to a workspace.
The Map View and the Compass
The map is a 3D view of the datasets available in the organisation. A user can pan the view, zoom in and out and even tilt the view to a new angle.
To tilt the view a user can press and hold the mouse wheel while moving the mouse.
To reset the view it is best to use the compass tool, clicking on the options available inside the compass wheel.
The Map Tools
Four map tools are available on the righthand side of the map. From the top down, these are as follows:
- The search button.
The search button allows for searching against a latitude and longitude. Soon, we will also offer support for place names.
- Full Screen.
The map can become fairly covered with the various panels which open up in the product. Clicking on the full screen button will allow the system to hide the panels in order to maximise the image and map view.
- Basemap
Clicking on the basemap button will cycle the basemap through the available basemaps. The available basemaps are a raster base map, a vector base map from OpenLayers and turning the base maps off.
- Transparency.
Some datasets can be obscured by the globe view or not be visible is it is a global dataset. This button allows a user to select the transparency options so the various points are available on the screen.
The Layer Properties
Layer properties has a variety of options and is layer dependent. A user must select the layer in order to open up this panel.
The vector file has several items a user can do. This includes viewing the attribute table, changing the symbology and other visualisation features. If the dataset has a timeseries capability, the system will allow you to play through the data from this panel.
The raster file will display the attributes available for the file. This is more complex for the SAR file. It will also allow a user to rearrange the bands and adjust the histogram. Other options are also available for the raster file, including the ability to run or view the results of AI models and access some expert level layer specific toolsets, such as SAR processing.
The Menu Bar
The menu bar is the only common feature across the product, and allows the user to seamlessly navigate across the product. Broken down into three distinct sections for ease, the user can navigate to different modules available for that user; see any notifications; upload new data from any point in the product; and use the avatar to access other items (such as help, or the user's profile).
Data Acquisition
Data Acquisition allows a user to request new data from the various vendors which are currently supported.
It is important to understand the different modes and vendors and how they apply to your task. If you have any doubt on this please use the contact us form to get more guidance.
This is the current layout of the data acquisition page:
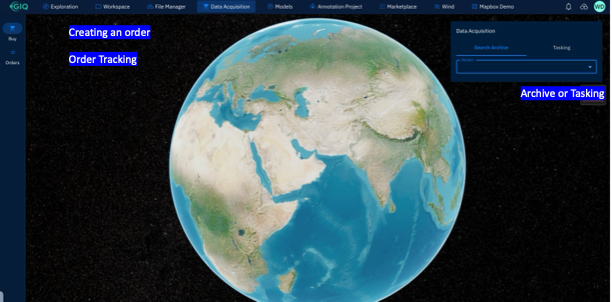
There are two key components on this page. The left hand hand bar shows if you are in the data acquisition page or the order tracking page. The right hand side shows the way we place an order, which can be either an archive request or a tasking request.
For the right hand panel the system will ask you to select a vendor. More documentation will appear on this site to explain the various vendors available to you through this system. Each vendor is unique in the products they offer, and once you have selected a vendor this panel will reflect the different options available to you.
At the moment, the following vendors are supported in gIQ data acquisition:
SAR
Please view the ICEYE product guide for more information on the products supplied by this vendor
- This is for Archive and Tasking
Sentinel-1 https://www.esa.int/Applications/Observing_the_Earth/Copernicus/Sentinel-1
- This is for Archive only
Multispectral
Satellogic https://satellogic.com/
- For tasking only
Planet Labs https://www.planet.com/
- For archive only
The Orders Page
There is significant potential complexity when using satellite imagery and placing orders. We try to provide clarity about the points involved, which is why we have a clear order tracking system available.
The system allows a user to view the order and it's progress through the approvals. For some vendors who are connected via API, it will also show the status of the collection of data.
It is important to note that the acquisition of satellite data can be expensive. Once the organisation administrator has approved an order the system will assume it is a confirmed order.
You are able to cancel an order upto the point of collection. However, different suppliers have different cancellation policies. Depending on the amount of time preceeding the collection you may still be charged for the full amount of the acquisition.
Workspaces
Workspaces are the core of the gIQ product. It is where most of the manually triggered processing occurs and where the creation of new files occurs. This is a complex area of the product and it is imperative that users consult the main user guide documentation for the various features within the workspace. This part of the guide will just give a very high level overview of the workspace.
Workspaces allows a user with the correct permissions to thematically collect their data in one location. This theme can be as simple as a static list of data which intersects with a area of interest, to being as complex as all raster files which contains the detections of a specific AI model output between a certain time range in a certain area of the world, to be constantly refreshed with new data when new data is available. The workspace allows the user to configure the rules for that analytics and to set the permissions for it.
Here is the layout of the workspace in the workspace exploration view:
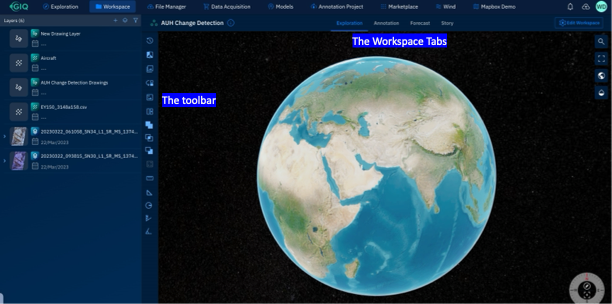
The workspace has the same view and functionality as the exploration view. This is purposely done so the user has a common theme throughout the product. The two major new features within the workspace are the toolbar and the workspace tabs.
Please consult the workspace user guides to get more details on the specific tools available.
The tabs across the workspace will alter the toolbar, which is specific to the tab. For example, the annotation tab will give the user access to the annotation workflow. As a reminder, the term annotation within gIQ specifically refers to the building of datasets for data science workflows.
The stories tab, which is furthest to the right of the tabs, allows the user to start creating stories in the product. This allows the user to create interactive stories which the consumer of the story can be immersed in the analytics which have been done within the workspace. For more details on this complex, but intuitive feature please consult the relevant user guides.
The forecast tab moves the view to a graphical view. There is no map available in this tab. This allows the user to interact with the time series data in the workspace to produce a line graph. It will also allow the user to run a forecast model on the data, should the user choose to do so. This particular feature will iterate over time to increase the value of it within the product. Stay tuned for some exciting developments on this feature, including the increased ability to create different graphs and publish them into a story.
The Marketplace
The marketplace is another core feature within the product. This feature allows organisations to publish their own applications and models into the marketplace for other entities to access or make use of.
There are two different objects within the marketplace - applications and models.
For both, the owner of the application or model can use the text editing features when placing the object onto the marketplace to market the object and provide a EULA for it. As the marketplace martures more features and statistics will become available, and we would like to know what statistics would be useful to an owner of a marketplace item. Please use the contact us form to provide your suggestions!
Applications
The application allows users to view the applications of other entities within the geospatial ecosystem. Depending on the level of integration with gIQ, these applications cards can either provide a simple web link to an external application or provide a single sign on for the application. Future iterations may allow deeper integration and have the data and processing hosted within the gIQ product. Stay tuned for this exciting development!
Models
The other object type within the gIQ environment is the AI model.
Once a model has been successfully integrated onto an organisations environment inside gIQ, that organisation can place the model onto the marketplace. A user of another organisation can then request to subscribe to the marketplace item, which is controlled by the users of the owning organisation - assuming they have the correct permissions set.
On acceptance of the subscription request, the customer of the model will see the model placed inside their models directory. It will be registered to that customer organisation, but ownership of the model will remain with the original organisation who put the model on the marketplace. The customer will have to do a few things before they can begin using the model, such as setting new parameters if they require to, setting the label mapping to a category and also ensuring that the model is active.
AI Models
gIQ is built for AI models on Geospatial Data. This is where this product differentiates itself from the crowd. Aside from the marketplace and making use of the models, there are two other locations within the product that the AI models are present. These are the model management page and the "Annotation Projects" page.
Model Management
The management of AI models in an organisation is vital to the use of AI models. In many different models the labels generated by an AI model simply do not make sense to the normal user. It is important that the model management page is correctly set up and understood to maximise the effectiveness of the AI models.
Here is what the AI model management page looks like:
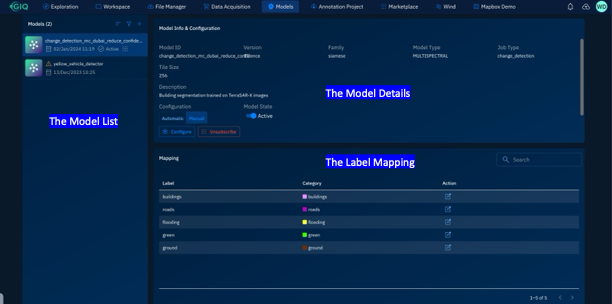
The three zones in the model management page are the model list, the model information and the model mapping.
The model list shows a list of models which are available to a particular organisation. At the top of the list is the ability to filter the models and the ability to add a new model if required. However, adding a new model is currently seen as a data science responsibility. Please consult the relevant guides to understand this workflow.
The model configurator allows the user to do a few options. If there are multiple versions of a model, this part of the page allows the user to select the version of the model which is currently active. It also allows a user to activate and deactive any model which is in the organisation. Deactivation of a model will prevent the model from running or being available to run for other users in the organisation. If the model has already run the results of the model will still be available even if the model has been deactivated.
The configurator also shows certain parameters, such as the model family, which is collected from the metadata file which was uploaded with the model. It will, however, allow the user to select some parameter form the model such as constraining the resolutions available for the model to run. For example, if the lowest resolution permitted is 1m, the model will not show for a raster file which has a spatial resolution of 2m.
Finally is the automatic or manual running of the model. If the automatic option is selected, any raster file which meets the parameters of the model configuration will have the model run automatically. This is a potentially expensive option as it could consume GPU resources when not expected.
The model mapping part of this page allows the user to select what the label means in the product. It takes the output of the model and essentially allows the user to translate it into something meaningful for the other users in the organisation. For example, a model may generate an output of 1, which makes no sense to the everyday user unless it is mapped to the object intended, such as aircraft.
Automatic Model Development
The page of "annotation projects" is where this product allows a user to create a new AI model based on the annotations in the product and in a no-code environment. This feature is generally used for more advanced users.
The workflow of this feature is as follows.
First the user can create annotations on the relevant data within a workspace. These annotations can be selected to enter an annotation project. Once the annotations are in the project the user can then go to the annotation projects page and see the specific annotation project required.
On selecting the annotation project there are some information based on the number of annotations in the project and the different layers which have been used for the annotations. There is also a verify button. On clicking the verify button the user has the option of naming the dataset before proceeding. The verification step is converting the dataset into a YOLO format, which is used to create AI models.
Once the dataset has been verified, the user can then proceed with making an experiment. This will allow the user to input some parameters and select a specific architecture before proceeding with the training steps. On clicking go the training will take place automatically. There is an option to view the training process, but this is specific for data science use.
On the successful completion of a model experiment, the model will be ready. At present, the user is required to download the model and upload it to the correct place. On selecting download the metadata file will also be downloaded which will be required to upload back to the system.
Supported Files and Limitations
gIQ supports a wide range of files, though some product limitations exist.
Raster Data
The product supports the following raster file types:
-
.tif
-
.nitf
-
.jp2
-
.ecw
-
.safe
-
.zip and .tar
It is highly recommended that all files are uploaded in their original format in a zip archive. This allows the system to examine the contents of the zip archive in order to ensure the correct ingestion of the file metadata.
Vector Files
-
.kml
-
.geojson
-
shapefiles (in .zip archive with correpsonding file types)
-
.cityJson
-
.czml
-
.csv - although the mapping of the data is essential for uploading. The files must have date and time aswell as a latitude and longitude.
Other data types
gIQ allows for the upload of other files.
A user can also upload jpegs and pngs in the same format as a satellite data. This will store the file as a layer in the system. If that file has exif data the file should automatically be geolocated. Other methods for uploading jpegs and pngs, which do not need to used as a different layer, can be done as well. An example of this would be adding a jpeg in a story description.
A user can also upload full motion video in MPEG or MP4 formats. The system supports the running of AI models on full motion video, where such models exist in your organistation or have been subscribed to from the marketplace.
The product does support the ability to visualise NetCDF. These are highly complex files to provide a generic uploading framework to. This capability will arrive in the product once further feature discovery is done.
Limitations
There are some limitations with the gIQ product. The product does not yet support .kmz files and it does not support the uploading of .csv files without any mapping. The data must conform to ISO DTG and have a latitude and longitude for the files.
While the product supports exif data embedded in the jpegs, the system does not yet support GPX.