Analyst User Documentation
The platform enables analysis of different types within the product.
If you are an analyst, the key area is the workspace. This is a thematic collection of a dataset of the users choosing. It is therefore essential that the workspace permission is enabled for an analysis user.
The entire philosophy of the product is to democratize the geo-spatial analysis to enable all industries and individuals to gain insights out of the pixels which have been delivered to the organization they are a part of. This includes the use of a marketplace to enable the space based industries to market and sell their applications.
What is a Workspace?
In simple terms, a workspace is a meta-project that allows you to create, edit, collaborate, and manage multiple thematic projects simultaneously.
Think of a workspace as a container for your projects — a place where you can collect various resources (datasets, images, GeoJSONs, PDFs, CSVs, and more) to create stories, publish on the marketplace, collaborate on annotation projects, gather and share insights, and analyze data.
A workspace provides a unified and secure experience, enabling streamlined interactions between you, your coworkers, and supervisors. Each workspace project has its own privacy controls, purpose, theme, layers, statistics, dashboard, and more.
Getting Started with Workspaces
In this section, you'll learn how to:
- Access the workspace module
- View active and archived workspaces
- Filter, sort, and search a workspace
Accessing the Workspace module
Let’s see how to access a workspace:
-
Login to the platform.
-
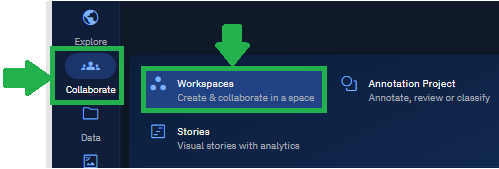
In the right-hand panel, click the Collaborate module, and then click the Workspaces tile.

The Workspaces Dashboard page is displayed.
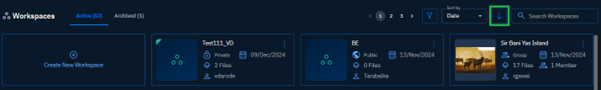
By default, the platform displays all the Active workspaces.
-
In the Workspaces page, you can do the following:
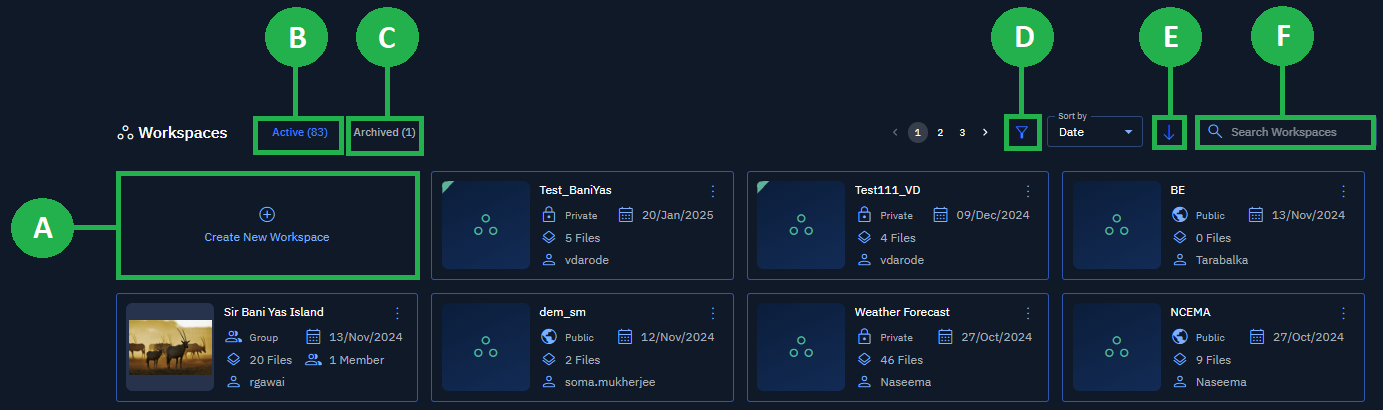
A. Create a workspace.
B. View active workspaces.
C. View archived workspaces.
D. Filter a workspace.
E. Sort by date or name.
F. Search a workspace.
Workspace Management
Manage your workspaces easily in the platform by viewing, searching, sorting, and so on...
Viewing Active Workspaces
In this section, you will learn how to view active workspaces.
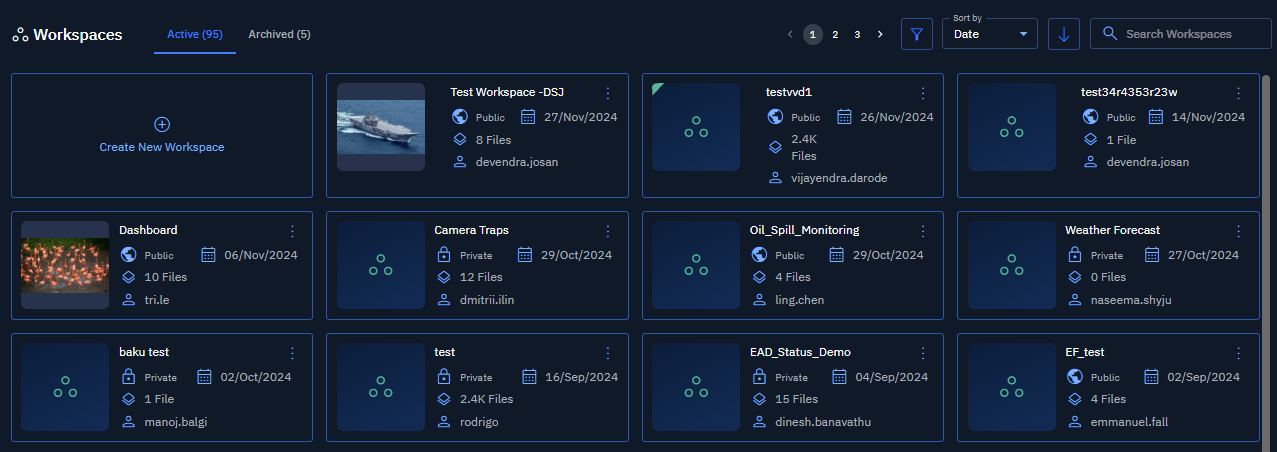
When you click the Workspaces modules, the Workspaces Dashboard page will be displayed. By default, the Workspaces Dashboard page displays all the active workspaces.
Now depending on the following conditions, you can:
-
View your created workspaces (private workspace).
-
View workspaces created by others (public workspace).
-
View workspaces you are part of (group workspace).
-
View and/or manage workspaces based on your role and access rights.
New platform users who do not meet any of the preceding conditions will not be viewed in any workspaces.
Viewing Archived Workspaces
In this section, you will get to know how to view archived workspaces – workspaces that are not in use anymore.
To view the archived workspaces, do the following:
-
Login to platform.
-
In the right-hand panel, click the Collaborate module, and then click the Workspaces tile.
The Workspaces Dashboard page is displayed.
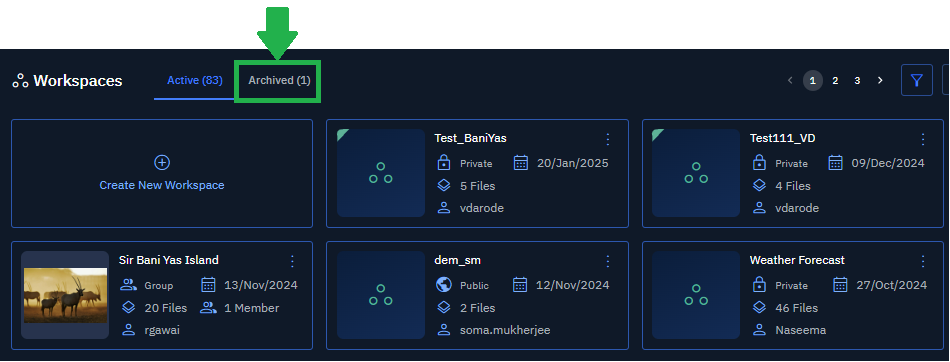
- In the Workspaces Dashboard page, click the Archived tab, and then proceed to view and access all the archived workspaces.
Filtering Workspaces
Filter and access workspaces created by a specific user in a few clicks.
To filter workspaces, do the following:
-
Login to the platform.
-
In the right-hand panel, click the Collaborate module, and then click the Workspaces tile.
The Workspaces page is displayed.
- In the Workspaces page, click the Filter icon, and then click the Created by drop-down list to select a specific user from your organization.
All the workspaces created by the user are displayed.
NOTE: Select multiple users in one go to view all their workspaces.
Sorting Workspaces
Sort and view workspaces by date and the name of the workspace.
To sort out workspaces, do the following:
-
Login to the platform.
-
In the right-hand panel, click the Collaborate module, and then click the Workspaces tile.
The Workspaces page is displayed.
- In the Workspaces page, under the Sort by drop-down list, do the following:
-
Select the Date option to sort workspaces created by date. Use the Up and Down arrow to sort workspaces in ascending or descending order.
-
Select the Name option to sort workspaces by name of team members in your organization. Use the Up and Down arrow to sort workspaces in ascending or descending order.
Searching Workspaces
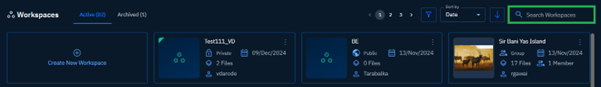
Type a workspace name in the search box to find it.
To search for workspaces, do the following:
-
Login to the platform.
-
In the right-hand panel, click the Collaborate module, and then click the Workspaces tile.
The Workspaces page is displayed.
- In the Workspaces page, type a workspace name in the Search Workspace search bar. Search results are instantly displayed as you type the workspace name.
Creating & Configuring a Workspace
In this section, you will learn how to create a new workspace by taking the following steps:
-
Getting to know the components of the Workspace
-
Setting Up Workspace Name & Thumbnail
-
Setting Up Workspace Privacy
-
Setting Up Dynamic Files Filters
-
Adding Static Files to the Workspace
Setting Up Workspace Name & Thumbnail
Get to know how to set up a workspace name and thumbnail thus enabling you and other users in the organization to visually identify a workspace.
To set up workspace name and thumbnail, do the following:
-
Login to the platform.
-
In the right-hand panel, click the Collaborate module, and then click the Workspaces tile.
The Workspaces Dashboard page is displayed.
- In the Workspaces Dashboard page, click the Create New Workspace tile.
The Create New Workspace dialog box is displayed.
-
In the Create New Workspace dialog box, under the Workspace Info tab, type the workspace name in the Workspace Name field.
-
In the Create New Workspace dialog box, under the Thumbnail section, click the Browse button, select the image that you want to display as the workspace thumbnail.
-
Do one of the following:
-
Click the Save button to save and exit.
-
Click the Next button to go to the next screen.
-
Click the privacy options under the Workspace Privacy section to set up privacy of the workspace.
-
Setting Up Workspace Privacy
Set up workspace privacy to enable private, public, or group access to a workspace.
To set up workspace privacy, do the following:
- In the Create New Workspace dialog box, under the Workspace Info tab, in the Workspace Privacy section, select one of the following workspace privacy options:
| Workspace Privacy | Description | Workspace Visibility |
|---|---|---|
| Private | A workspace that is open for only you. | Only you can view and edit this workspace |
| Public | A workspace that is open to all the users in the organization | All users can view and edit this workspace |
| Group | A workspace that is open to only team members selected in the group | All users in the group can view and edit this workspace |
- Do one of the following. This depends on the Workspace Privacy option you select from the preceding step:
-
For Private and Public workspace privacy options, click the Next button on the Edit Workspace dialog.
-
For Group workspace privacy option, search and/or select the team members who will receive viewing and editing rights to this workspace, and then proceed to click the Next button.
Setting Up Dynamic Files Filters
Search, select, and allow dynamic addition of layers and categories (that meet pre-defined criteria) in the workspace.
For example, you create a new AOI on the map and populate it with SAR images as layers. When you set up the dynamic files filter, new SAR images (that are uploaded to the application) will be automatically added to the AOI. Now whenever any new SAR images of the AOI are uploaded, the application will automatically populate area with the new images.
To set up dynamic file filters, do the following:
-
In the Create New Workspace dialog box, under the Dynamic File Filters tab, click the Create New Filter button.
-
Click the Source Data Type drop-down list and select the data type that you want to enable in the workspace.
-
Click the Categories drop-down list to select type of categories that can be enabled in the workspace. Furthermore, you can click the > icon to open a specific category to view and add a sub-category. For example, click the aircraft category to open, view, and add sub-categories namely B52, F16, F35, MIG 31, and so on…
-
Select the Start Acquisition Date and End Acquisition Date of the images that you want to dynamically filter onto the Area of Interest (AOI).
-
Click the Draw An Area of Interest (AOI) button to draw a specify a geographic extent on the map. Once an area of interest is specified, all the current and future images of this specified area will be automatically made available to you.
-
Click the Save button, and then click the Next button.
Adding Static Files to the Workspace
Add single or multiple files of the same or different formats from the images library to the workspace.
To add static files, do the following:
-
In the Create New Workspace dialog box, under the Static File List tab, select the appropriate files to add to the workspace.
-
Click the Save button to add the images to the workspace.
NOTE: If you are new to using the platform, you might not see any images in the static file list tab because you have not uploaded any images to the platform yet.
Dynamic files are like temporary files that can be added or removed as needed. You can draw an Area of Interest (AOI) and specify which types of files (formats, category, sub-category) should be included. If any user in your organization uploads matching files, they will be automatically added to the AOI.
Static files, on the other hand, are permanent files. Once uploaded to the library, these files can be searched and reused across any workspace you choose.
Working with Workspaces
In this section, discover how you can navigate the workspaces module to execute your projects, stories, annotations, and so on.
A Workspace page and the Explore module share the GUI and common functionalities. However, the workspace page has some additional features that further extend its capabilities. In this section, you will get to know how to use these additional features available in a Workspace page.
| Feature | Description |
|---|---|
| Adding Layers |
|
| Utilizing Analyst Tools |
|
| Editing a Workspace |
|
The following Workspace screenshot illustrates:
-
The GUI and common functionalities between a Workspace page and the Explore module marked in GREEN
-
The additional features in a Workspace page marked in YELLOW
For the common functionalities, see the Explore module section.
-
Layers List: View the existing and/or the layers that you add to the workspace in this section.
-
Layers Manager Ribbon: Add new layers (Drawing layer and Vector layer) on the Workspace page. Common features include toggle footprints visibility, sort layers, and filter layers.
-
Analyst Tools Ribbon: Use the analyst tools ribbon to execute several tasks. For example, you can find the difference between two vector layers, compare two images, measure ground length, and so on.
-
Workspace Tabs: Visualize and analyze datasets. Consists of the Explore module, Insights module, Dashboard, Annotation module, and the Story module. Each of these tabs is a module that enables you to achieve your goals in geospatial analysis. Common functionality available in both the Explore module and Workspace page.
-
Edit Workspace: Make changes to the way the workspace was set up in the first place. For example, make changes to the workspace set up like changing the name, making the workspace public or private, creating a new dynamic filter, and so on. Available in the Workspace page only.
-
Workspace Map options: Visualize the map in various ways. Type the location or copy-paste the coordinates to quickly jump into a specific location. Work in a full-screen mode for better user experience. Adjust transparency of the workspace map or simply toggle the map view. Common functionality available in both the Explore module and Workspace page. ** **
-
Azimuth & Lat-Long: Switch between Lat-Long and MGRS coordinates or Zoom in Zoom out easily or simply reset the azimuth for true north. Common functionality available in both the Explore module and Workspace page.
-
Base Map Layers: Select a base map that will serve as a reference map on which you overlay data from layers and visualize geographic information. Additionally, you can add one or more layers from this option and a height map of your choice. Common functionality available in both the Explore module and Workspace page.
Getting Started with Layers
Layers are basically datasets that you upload to the platform.
In addition to the layers that you can add by uploading datasets through the File Manager sub-module, you can add (and remove) the following additional layers via the Workspaces: Drawing Layer and Vector Layer.
Drawing Layers vs. Vector Layers
You can use each of these layers for a specific purpose in the platform:
| Name of the layer | Description |
|---|---|
| Drawing layer | Create custom annotations and markups. |
| Vector layer | Visualize and manage vector data. |
You can add a drawing or vector layer in three easy steps:
-
Create a drawing layer or vector layer.
-
Add one or all the following features onto the layer:
-
Use points for specific locations like landmarks or sample sites
-
Create lines for linear features such as routes or boundaries
-
Draw polygons to represent areas like parcels or zones
-
Add text annotations to provide context or labeling.
-
-
Customize the appearance of your features by adjusting colors, line weights, fill patterns, and text to ensure your geospatial feature information is clearly visible.
Vector Layers with Temporal Attributes
One of the most crucial elements in geospatial datasets is time. When time is combined with location information, it is called as temporal data. Temporal data represents a state at a specific point in time. It allows you analyze and visualize changes and patterns over time, providing valuable insights into various phenomena.
With the platform, you can upload specific datasets that include timestamps or have observations recorded at multiple time steps to display temporal data on the map in a chronological sequence. You can better visualize the temporal data with the help of animation features namely viewing series of feature points on the map, the entire time series as a single-track line, set a 3D model (boat, plane, car, drone) instead of a point, and so on.
Adding a Layer
In this section, you learn how add a drawing layer, use all the options in the drawing layer, and how to permanently remove a drawing layer.
Adding a Drawing Layer
Go ahead and create features to symbolize anything on a map with the drawing layer. The drawing layer is like a collection of these features. You can add descriptive text and upload images to precisely annotate these features. The following type of features can be added to the drawing layer: lines, polygon, line, point, and text.
Prerequisites:
It is assumed that you have created a workspace, proceeded to open and work on the workspace.
To add a drawing layer, do the following:
- In a workspace page, click the + icon in the Layers Manager Ribbon.
The Create New dialog box is displayed.
- In the Create New dialog box, click the Drawing Layer option
A new drawing layer is added into the Layers List section. In addition, a new set of drawing layer options are activated on the Analyst Tools Ribbon.
Adding a Vector Layer
Vector layers store geographic data as points, lines, polygons, or text that represent discrete real-world features. However, you can also add attributes that are fundamental components of vector data that provide contextual information about geographic features.
When you add attributes to a vector layer, you are essentially defining a structured data schema that:
-
Contextualizes spatial data: Transforms geometric points, lines, or polygons from mere spatial entities into information-rich features with specific properties.
-
Enables complex analysis: Facilitates spatial queries, filtering, and analysis based on non-spatial characteristics.
-
Supports data integrity: Enforces data type constraints (for example, ensuring population figures are stored as numbers, not text).
-
Enhances interoperability: Creates standardized structures for data exchange between different GIS systems and databases.
With vector layers, you can visualize geospatial information using symbols, text, and graphics while enabling precise analysis and measurement of geographic relationships.
To add a vector layer, do the following:
- In a workspace page, click the + icon in the Layers Manager Ribbon.
The Create New dialog box is displayed.
-
In the Create New dialog box, click the Vector Layer option.
A New Vector Layer dialog box is displayed. -
In the New Vector Layer dialog box, do the following:
-
Type name of the new vector layer. For example, UAE_Airports.
-
Click the Add Attribute button.
-
-
In the New Vector Layer dialog box, do the following:
-
Type a name for the vector layer. For example, UAE_Airports.
-
Click the +Add Attribute button to add contextual information about geographic features (that you draw or insert in the vector layer).
-
The attribute columns Property Name, Default Value, and Type are displayed.
- In the New Vector Layer dialog box, enter the attributes for features that you will be adding in the vector layer.
For example, you want to make a note of the airports in major cities in the UAE and the commercial planes present on these airports. Accordingly, you must add the following attributes:
- Click Save to save the vector layer with the attributes.
Creating a Vector Layer with Temporal Attributes
In the following procedure steps, we will see how to upload a .csv dataset (consisting temporal data) to the platform and visualize the data.
Pre-requisites: Keep the dataset with temporal attributes read, upload the dataset, and then proceed to enable the temporal control settings in the platform.
To create a vector layer with temporal attributes, do the following:
-
Locate the workspace where you want to upload dataset with temporal attributes, open the workspace, and then click the Upload button.
The File Upload dialog box is displayed. -
In the File Upload dialog box, do the following:
-
Click the Browse button to select the dataset you want to upload.
-
Select the Add all to workspace thereby adding the dataset to the workspace you have accessed.
-
Click the + icon to open to the Data Mapping dialog box which enables you to specify how different columns in the .CSV should be interpreted within the platform.
-
-
Click Apply to set the data mapping.
-
Confirm mapping is successfully applied and then click Upload to upload the .CSV to the platform.
-
Click Close to close the File Upload dialog box.
-
Select the .CSV file in the File Explore panel.
The Properties contextual panel is displayed.
- In the Properties contextual panel, click the Temporal section to open it, and the select the Enable Temporal Control checkbox to enable temporal attributes of the layer.
Removing a Layer
The procedure of removing a layer is the same for both the drawing layer and the vector layer. Once a layer is removed, it cannot be retrieved.
To remove a layer, do the following:
-
Locate the layer that you want to delete in the Layers List panel.
-
Select the layer and then click the vertical three dots option of the layer and click the Remove option.
-
Click the Delete button on the confirmation message to permanently delete the layer. Remember once a layer is deleted, it cannot be retrieved.
Managing Layer Properties
You can edit the properties of both – the drawing layer and the vector layer from the contextual properties panel.
Drawing Layer Properties
When you add a drawing layer, you can edit the following metadata of the layer:
-
Name of the layer
-
Acquisition date
To edit a layer, do the following:
-
Locate the drawing layer in the layers list panel to edit its properties.
-
Select the drawing layer to view the properties.
The Properties contextual panel is displayed.
| Properties Field Name | Description |
|---|---|
ID | Unique alphanumeric ID of the layer |
Name | Name of the layer |
Ingestion Date | Date and time when the layer was ingested |
Owner | Name of the owner and creator of the layer |
Acquisition Date | Date and time when the layer was acquired |
Source | Source of the layer |
Source Type | Type of layer source |
-
In the Properties panel, in the Name section click the Pencil icon, type a new name, and then press Enter to change the drawing layer name.
-
In the Properties panel, click the Calendar icon in the Acquisition Date, select an appropriate date and time from the calendar, and then click OK.
Vector Layer Properties
When you select a vector layer, the Properties contextual panel is displayed.
In the Properties panel, you can view the following sections:
| Section Name | Description | Action to take |
|---|---|---|
| Metadata | Displays the ID, Name, Boundary, Ingestion Date, Owner Name, Acquisition Date, Source, and Source Type of the layer. |
|
| Features | Displays the total number of features on the layer. |
|
| Appearance | Displays options to style features by layer (global level) and feature (individual level) |
|
| Labels | Displays options to insert and style label for each feature. |
|
| Temporal | Displays options to enable temporal control. (This option is available only if the vector layer has temporal attributes) |
|
Getting Started with Features
In this section, you will get to know how to draw features, edit features and feature properties, and delete features in both the drawing layer and the vector layer. In addition, you will also learn how to export the features of GeoJSON and KML/KMZ.
In both the drawing layer and vector layer, you can draw a polygon, line, and point. However, in the drawing layer - you can draw or insert an additional feature called the text feature. Furthermore, in the drawing layer, you can insert a point in two ways: point and symbol.
See XXX for more information.
It is also worth noting that the procedure of editing vertices of a feature (polygon, line, and point) is the same in the drawing layer and vector layer. However, the procedure of styling features different in both the layers. See XXX for more information.
Drawing Features
Let’s get started with drawing features namely polygon, line, point, and text in drawing layer and vector layer. As mentioned earlier, the text tool is available in the drawing layer only.
Drawing Layer
In addition to drawing or inserting polygon, line, point (that is common across both the drawing layer and vector layer), you can do draw or insert the following additional features in the drawing layer:
-
Draw or insert point tool in two ways: point and symbol.
-
Draw or insert a text tool.
Polygon Tool
As the name suggests, you can use the polygon tool to draw a polygon feature that is a GIS object that stores its geographic representation. It is but a series of X and Y coordinate pairs that enclose an area.
Prerequisites: In the following procedure steps, it is assumed that you have accessed a workspace page, selected a new or existing drawing layer or vector layer, and now you are ready to draw or insert a feature.
To draw a polygon feature, do the following:
-
On the Analyst Tools Ribbon, click the Pencil icon and then click the Polygon icon to activate the feature.
-
Locate a place on the map (where you want to draw a polygon) and then click on the map to insert the first vertex of the polygon.
-
Proceed to insert vertices and double click to complete a polygon.
The Properties panel is displayed. -
In the Properties panel, do the following:
-
Click the Fill Colour field to select a colour of the point or copy-paste a hexadecimal (HEX) color
-
Click the Stroke Color field to select a colour of the point or copy-paste a hexadecimal (HEX) color and then proceed to increase or decrease the width of the stroke (boundary) in the Width field.
-
-
Type description of the point in the Description field.
-
Click the Browse button to upload a graphic or photo to add a visual description of the point.
Line Tool
You can use the Line tool to draw a line on a map. A line is a shape defined by a connected series of unique X and Y coordinate pairs.
Prerequisites: In the following procedure steps, it is assumed that you have accessed a workspace page, selected a new or existing drawing layer or vector layer, and now you are ready to draw or insert a feature.
To draw a line feature, do the following:
-
On the Analyst Tools Ribbon, click the Pencil icon and then click the Line icon to activate the feature.
-
Locate a place on the map (where you want to draw a line) and then click on the map to insert the first vertex of the line. Continue drawing the line by clicking on the map canvas to set vertices.
-
Double-click to finish drawing the line.
The Properties panel is displayed. -
In the Properties panel, do the following:
-
Click the Stroke Color field to select a colour of the point or copy-paste a hexadecimal (HEX) color and then proceed to increase or decrease the width of the stroke (boundary) in the Width field.
-
Select an appropriate start and end line terminators from the Line Start and Line End drop-down list. Then proceed to select a stroke style from the Stroke Style drop-down list.
-
Point Tool
You can use the point tool to draw or insert a point as a geo location in both the drawing layer and vector layer.
The procedure to draw or insert a point remains the same for both the layers however when you insert a point in the drawing layer, you can insert the point as a point or a symbol.
Prerequisites: In the following procedure steps, it is assumed that you have accessed a workspace page, selected a new or existing drawing layer or vector layer, and now you are ready to draw or insert a feature.
Point
A point is a geolocation that you can draw or insert on the map.
To draw a point, do the following:
-
On the Analyst Tools Ribbon, click the Pencil icon and then click the Point Tool icon to activate the feature.
-
Locate a place on the map (where you want to draw a point) and then click on the map to insert the first vertex of the point.
The Properties panel is displayed. -
In the Properties panel, do the following:
-
Type a number to increase or decrease the size of the point in the Point Size field.
-
Click the Fill Colour field to select a colour of the point or copy-paste a hexadecimal (HEX) color
-
Click the Stroke Color field to select a colour of the point or copy-paste a hexadecimal (HEX) color and then proceed to increase or decrease the width of the stroke (boundary) in the Width field.
-
-
Type description of the point in the Description field.
-
Click the Browse button to upload a graphic or photo to add a visual description of the point.
Symbol
A symbol – as the name suggests – depicts a specific location on the map with a symbol. For example, airport, amusement park, bank, and so on.
To edit a symbol, do the following:
-
On the Analyst Tools Ribbon, click the Pencil icon and then click the Select Tool icon to activate the feature.
-
Locate a symbol (or symbols) and then click and drag a symbol to change its location.
-
In the Properties panel, do the following
-
Locate a symbol that you want to change, click the symbol, search the symbol and then proceed to click it to drop the symbol on the map. In addition, change the size of the symbol.
-
Locate a symbol that you want to change, click the symbol, scroll down and select a symbol that you want to insert.
-
-
Change the description of the symbol in the Description field.
-
Click the Browse button to upload a new graphic or photo to add a visual description of the point.
Vector Layer
Vector layers consist of three basic GIS features – lines, points, and polygons. These features represent real-world features in the digital format.
In addition to the above, text is also a
Here’s how you can use these features to represent real-world features:
| Feature | Real-World Locations |
|---|---|
| Points | Cities, Towns, Buildings, Events, and so on… |
| Lines | Roads, Canals, Railways, and so on. |
| Polygons | Boundaries of a City, State or Country. |
Polygon Tool
You can edit the styling of a polygon by simply selecting it and changing the fill and stroke color. In addition, you can also change the width of the stroke.
Prerequisites: In the following procedure steps, it is assumed that you have accessed a workspace page, selected a new or existing drawing layer, and now you are ready to edit the feature.
To edit a polygon feature, do the following:
-
Open a Workspace, click the Edit icon on the Analyst Tools Ribbon, and then click the Select tool.
-
Click the polygon that you want to edit.
The Properties panel is displayed.
- In the Properties panel, do the following:
-
Edit the Fill Colour field to select a new colour of the point or copy-paste a hexadecimal (HEX) color.
-
Edit the Stroke Color field to select a colour of the point or copy-paste a hexadecimal (HEX) color and then proceed to increase or decrease the width of the stroke (boundary) in the Width field.
-
Change the description of the point in the Description field.
-
Click the Browse button to upload a new graphic or photo to add a visual description of the point.
Line Tool
You can edit the styling of a line by simply selecting it and changing the stroke color and the width. In addition, you can also change the line start, line end, and stroke style.
Prerequisites: In the following procedure steps, it is assumed that you have accessed a workspace page, selected a new or existing drawing layer or vector layer, and now you are ready to draw or insert a feature.
To edit a line, do the following:
-
Open a Workspace, click the Edit icon on the Analyst Tools Ribbon, and then click the Select tool.
-
Click the line that you want to edit.
The Properties panel is displayed.
- In the Properties panel, do the following:
-
Click the Stroke Color field to select a colour of the point or copy-paste a hexadecimal (HEX) color and then proceed to increase or decrease the width of the stroke (boundary) in the Width field.
-
Select an appropriate start and end line terminators from the Line Start and Line End drop-down list. Then proceed to select a stroke style from the Stroke Style drop-down list.
Point Tool
In the drawing layer, you can draw or insert two types of point: point and symbol.
Point
You can increase the point size and the color.
Prerequisites: In the following procedure steps, it is assumed that you have accessed a workspace page, selected a new or existing drawing layer or vector layer, and now you are ready to draw or insert a feature.
Point
A point is a geolocation that you can draw or insert on the map.
To edit a point, do the following:
-
On the Analyst Tools Ribbon, click the Pencil icon and then click the Select Tool icon to activate the feature.
-
Locate the point and then click and drag a point to change its location.
-
In the Properties panel, do the following:
-
Type a number to increase or decrease the size of the point in the Point Size field.
-
Click the Fill Colour field to select a colour of the point or copy-paste a hexadecimal (HEX) color.
-
Click the Stroke Color field to select a colour of the point or copy-paste a hexadecimal (HEX) color and then proceed to increase or decrease the width of the stroke (boundary) in the Width field.
-
Change the description of the point in the Description field.
-
Click the Browse button to upload a new graphic or photo to add a visual description of the point.
Deleting Features
The process of deleting a feature is the same in both the drawing layer and vector layer.
Prerequisites: In the following procedure steps, it is assumed that you have accessed a workspace page, selected a new or existing drawing layer or vector layer, and now you are ready to delete an existing feature.
To delete a feature, do the following:
-
Open a Workspace, click the Edit icon on the Analyst Tools Ribbon, and then click the Select tool.
-
Select an existing feature on the map.
-
Click the Delete icon to permanently delete the feature. Repeat this step to delete other features on the map.
-
Click the Edit icon again to turn off the edit mode.
NOTE: Once a feature is deleted, it cannot be retrieved.
Exporting Features
You have the option of exporting layers with features as GeoJSON or and KML (Keyhole Markup Language) or KMZ (KML Zipped).
Exporting Features as GeoJSON
GeoJSON is an open standard geospatial data interchange format. This format represents simple geographic features and their nonspatial attributes.
Prerequisites: In the following procedure steps, it is assumed that you have accessed a workspace page, selected a new or existing drawing layer or vector layer, and now you are ready to export layer with features.
To export features as KML or KMZ, do the following:
-
Open a Workspace and then locate the layer that you want to export.
-
Click the vertical three-dots menu, and then click the Export as KML/KMZ option.
The layer is successfully downloaded.
Exporting Features as KML or KMZ
KML (Keyhole Markup Language) is an XML-based file format that is used for displaying information in a geographic context. KMZ is the compressed file format of KML. Both the formats are extensively used in the geospatial information world.
Prerequisites: In the following procedure steps, it is assumed that you have accessed a workspace page, selected a new or existing drawing layer or vector layer, and now you are ready to export layer with features.
To export features as KML or KMZ, do the following:
-
Open a Workspace and then locate the layer that you want to export.
-
Click the vertical three-dots menu, and then click the Export as KML/KMZ option.
The layer is successfully downloaded.
Dashboard
This section presents information on the Dashboard tab in the Workspaces module. It includes the dashboard components and how to use them effectively.
When you run AI models on layers available in the workspace, the dashboard displays rich insights related to detections. You can analyze these insights to make data-driven decisions, spot early trends, identify outliers, and share or download the raw data.
Components of the Dashboard
- Dashboard Filter Options – Filter detections by category, confidence score, and date range.
- Workspace Tabs – Click tabs to perform tasks. Tabs include: Exploration, Insights, Annotation, and Story.
- Type of Chart – Select Bar chart or Time series chart to visualize detections.
- Download Information – Download reports as
.csvfiles or raw data in.geojsonformat. - Search Categories – Type, search, and select a category to view detection counts.
- Dashboard Chart – View graphical representation using bar or time series chart.
Using the Dashboard
Before using the dashboard, ensure your workspace has appropriate images or videos and AI models have been executed.
To use the dashboard, do the following:
- Create a workspace with required privacy settings, dynamic filters, and static file list.
- Upload images or videos to your workspace.
- Run applicable AI models.
- Click an image or video to view category-specific detections in a bar or time series chart.
- Download reports (
.csv) and raw data (.geojson).
The dashboard provides a centralized view of all detection-related insights in a visually intuitive format.
Story
This section explains the Story tab in the Workspace module, including what a story is and how to use it.
What is a Story?
A Story lets you create, analyze, and share map-based narratives powered by geospatial data and AI. You can embed media such as images, audio, video, or PDFs.
Story points you can add include:
- Standard AOI
- Historical Imagery
- Comparison Slider
Once created, stories can be:
- Published on the marketplace
- Shared privately within your organization
- Exported as reports or pages
- Added to favorites
How to Use the Story Feature
Think of the narrative you want to build with your geospatial data. For example:
- The origin and spread of California wildfires
- Record rains that flooded the UAE
Viewing Story Points
To view story points:
- Click the Workspace > Story tab.
- Click Presentation Mode on the Story Composer dialog.
- In Presentation Mode, select a story point to view it.
Adding Story Points
Story types:
- Standard AOI – Draw AOI with visible map layers.
- Historical Imagery – Present images over time for an AOI.
- Comparison Slider – Compare two images from different dates.
Standard AOI – Steps
- Open a Workspace > Story tab.
- Click + to add a story.
- Name the story.
- Add Standard AOI point.
- Add description and media.
- Select layers and configure visibility.
- Optional: Enable/disable raster adjustments and vector legends.
- Click Save Story Point.
- Click Back to Stories or add more points.
- Click Presentation Mode.
Historical Imagery – Steps
- Open Workspace > Story tab > Add story.
- Name the story > Add Historical Imagery point.
- Add description and media.
- Enable autoplay (optional).
- Test presentation.
- Export images (with timestamp overlay).
- Adjust settings (acquisition time, layer name, speed).
- Click Back to Stories or add more points.
- View in Presentation Mode.
Historical story opens in a new window with the story name.
Comparison Slider – Steps
- Open Workspace > Story tab > Add story.
- Name the story > Add Comparison Slider point.
- Add description and media.
- Select two images for comparison.
- Save story point > Click Presentation Mode.
- In Presentation Mode, adjust the slider to compare images.
Editing Story Points
- Open Workspace > Story tab.
- Click Edit on the Story Composer.
- Select a story point, make changes.
- Click Save Story Point.
Deleting a Story Point
- Open Workspace > Story tab.
- Locate the story point > Click Delete icon.
⚠️ Once deleted, a story point cannot be recovered.
Exporting Story Points
Exporting Page
- Open Workspace > Story tab > Presentation Mode.
- Click Export > Export Page.
PDF is downloaded for the current story point.
Exporting Report
- Open Workspace > Story tab > Presentation Mode.
- Click Export > Export Report.
All story points are downloaded as a single PDF.
Managing Story Publishing on Marketplace
You can only publish/unpublish your own stories.
Publishing a Story
- Open Workspace > Story tab.
- Click More Options (⋮) > Publish on Marketplace.
- Fill the Marketplace form:
| Field | Description |
|---|---|
| Browse & Upload | Upload a display image |
| Type | Auto-selected |
| Title | Auto-filled |
| Story Description | Enter a summary |
| Search Tags | Add relevant hashtags |
- Add description and End User Agreement.
- Click Publish.
Unpublishing a Story
- Open Workspace > Story tab.
- Click More Options (⋮) > Unpublish on Marketplace.
The story is now unpublished.
Managing Workspaces
Only the workspace owner can edit, archive, or delete a workspace.
To verify ownership:
- Log in to the platform
- Click Collaborate > Workspaces
- The Dashboard displays workspaces you own and shared ones.
Marking Workspace as Favorite
To mark a workspace as favorite:
- Log in to the platform
- Go to Collaborate > Workspaces
- Click the Star icon on the workspace
Click again to remove it from favorites.
Editing a Workspace
You can edit a workspace either:
- From the Workspace Dashboard
- From inside a Workspace
From the Dashboard
- Log in to the platform
- Go to Collaborate > Workspaces
- Click More Options (⋮) > Edit on the workspace
- Make changes and click Save
From Inside the Workspace
- Log in to the platform
- Go to Collaborate > Workspaces
- Click the workspace to open it
- Click Edit, make changes, and click Save
Archiving a Workspace
To archive:
- Log in to the platform
- Go to Collaborate > Workspaces
- Click More Options (⋮) > Archive
- Confirm in the dialog by clicking OK
Viewing User List
To view users for a workspace:
- Log in to the platform
- Go to Collaborate > Workspaces
- Click More Options (⋮) > User List
A dialog box will show shared users.
Deleting a Workspace
To delete:
- Log in to the platform
- Go to Collaborate > Workspaces
- Click More Options (⋮) > Delete
- Confirm deletion by clicking OK
⚠️ Once deleted, a workspace cannot be recovered.